TradingView service was launched in 2011 to bring together traders from all over the world in an open area for the exchange of information and investment ideas. As conceived by the developers, the platform was supposed to combine the functions of a trading and analytical platform and enable the traders to quickly communicate with each other. The headquarters of the development team is located in New York, there are offices in Rostov, Moscow, and St. Petersburg, the central European office is located in London. Available in 18 languages. For a Russian-speaking audience, the presence of a version in Russian is a definite plus, but it should be noted right away that the English-language version has the largest audience.
Basic moments:
- Opportunities and advantages
- Trading platform overview
- What companies are currently working with the service
- The advantage of the possibility of “live” communication with other traders
- Conclusion
Opportunities and advantages
To date, TradingView has been recognized as the best analytic platform. TradingView provides features:
- full technical analysis with the maximum possible set of graphical tools, technical indicators, templates of ready-made strategies;
- selection of tools according to specified parameters using a screener;
- tracking of major economic news, corporate events, and other important information in the news feed, macroeconomic statistics calendar and company reporting calendar;
- trading stocks, derivatives contracts, cryptocurrency currency pairs by connecting a broker account to TradingView;
- exchange of opinions, investment ideas in a chat, publication of your investment ideas.
If we talk about the possibilities of TradingView in terms of conducting technical analysis, as an alternative, Forex traders use the Metatrader platform, but TV has many advantages, is much more functional, the amount of technical and fundamental information provided leaves this resource out of the competition. TV graphics are used by many reputable resources such as zacks.com, investing.com. and many others.
Trading platform overview
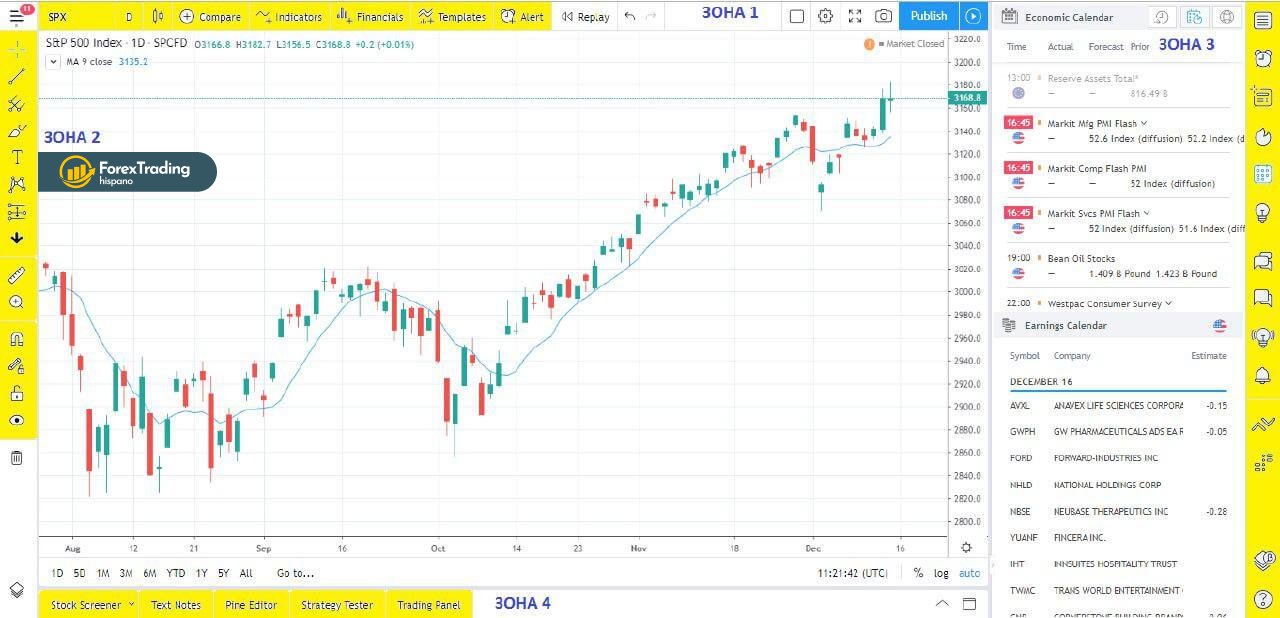
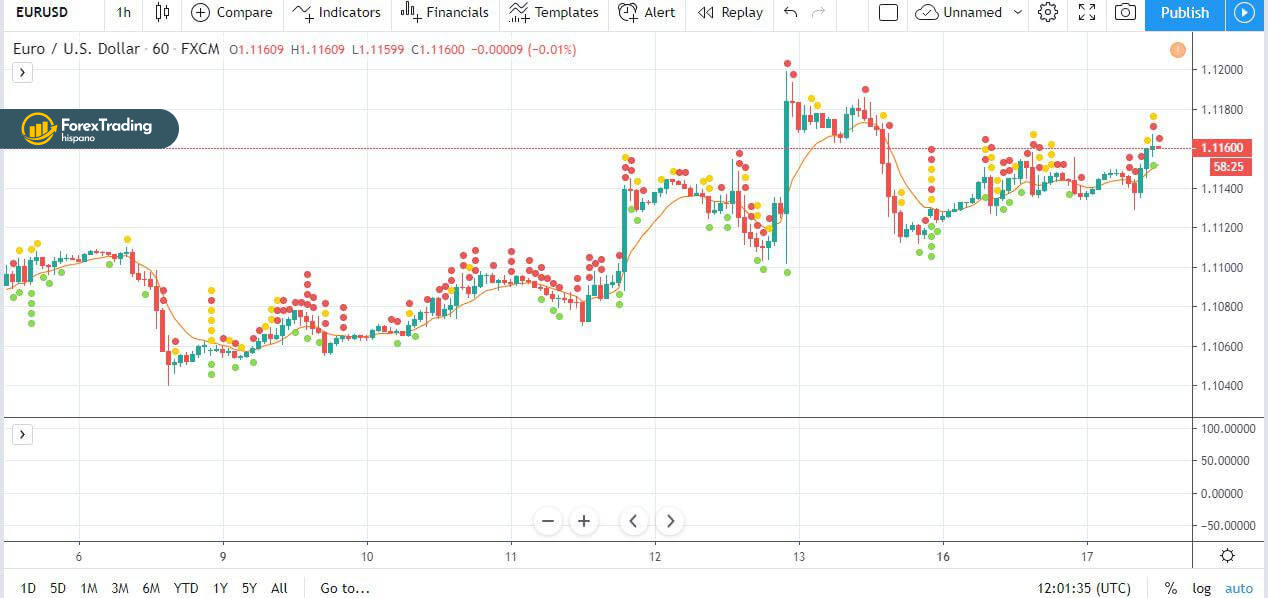
The platform interface is very concise and intuitive. Visually, on the main screen of the graph, 4 control zones can be designated, each of which carries a certain functional orientation.
- This is the top horizontal toolbar. There are windows on it: choosing a trading instrument, choosing a timeframe, joining other charts, technical indicators, strategies, templates of ready-made strategies, alerts, etc.
- The left vertical panel is used to control graphical tools;
- The right vertical panel contains watchlist activation windows, displays an economic calendar, company reporting calendar, a news feed, public chat, and a price glass.
- Bottom horizontal panel – contains screener windows with various selection parameters, scripts, and a strategy tester.
On the platform, you can create high-quality charts for the widest range of trading tools, such as stocks of international companies with quotes from various world exchanges, indices, cryptocurrencies, forex tools, CFDs. The time interval of the charts is selected from the drop-down list and has a wide range from a second to a month.
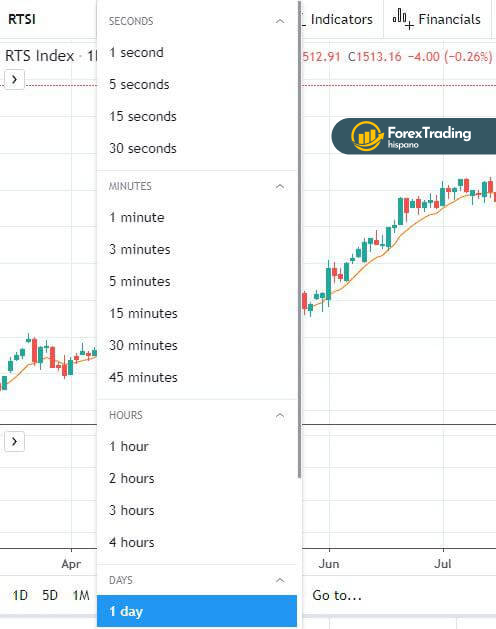
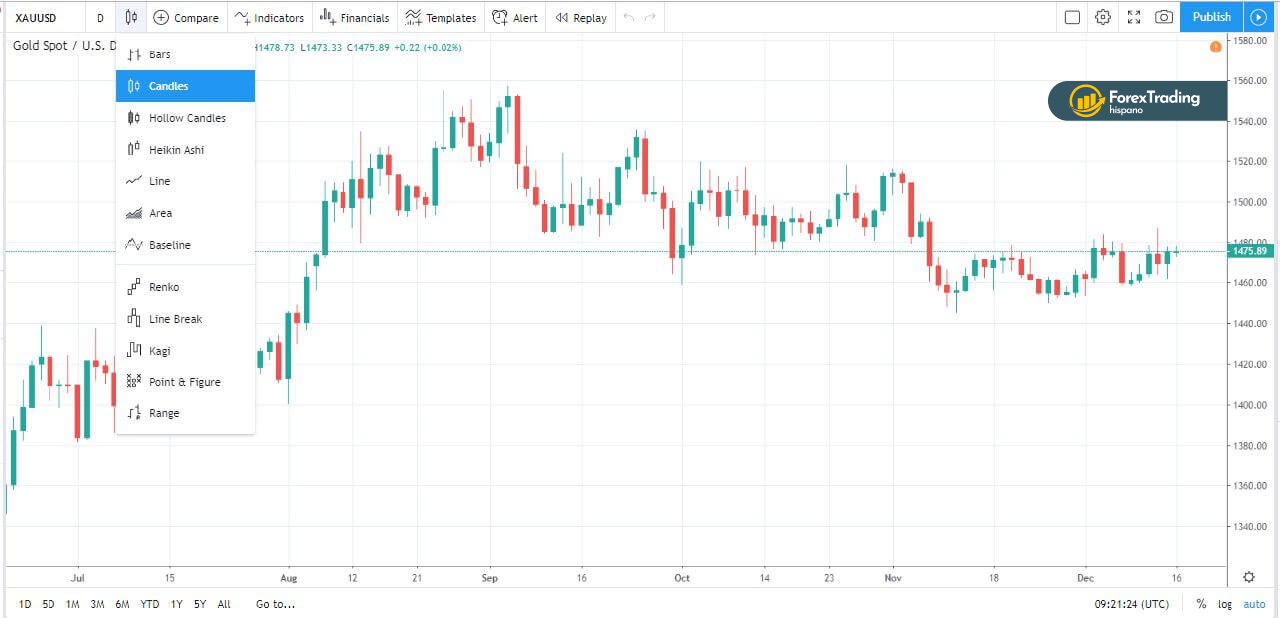
Users have the opportunity to choose the type of charts depending on their preferences and trading style – traditional – linear and others.
Trading View platform provides the ability to create a variety of trading strategies using technical indicators, as well as signals of ready-made strategies using popular indicators like Bollinger Bands, RSI, MACD, and others.
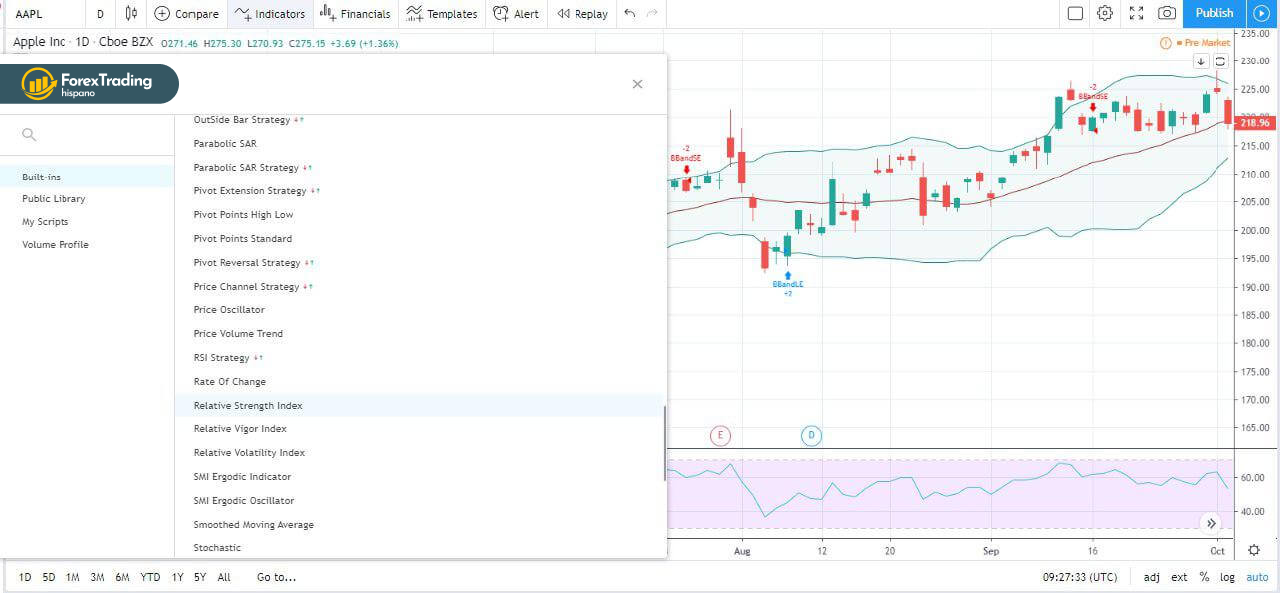
A pop-up window for selecting indicators and strategies based on them. By attaching other charts of direct or inverse correlation instruments to the chart of a trading instrument, you can obtain additional information for analyzing the current market situation.
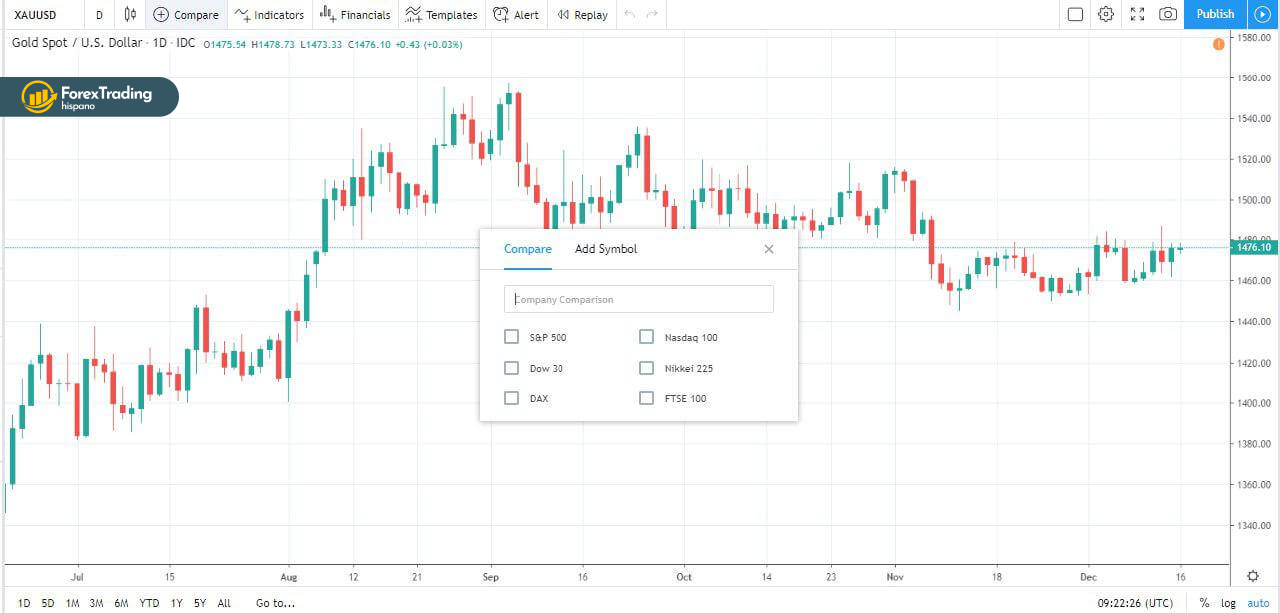
So, for example, it is logical to attach an index chart to the stock chart, of which it is a part, or it makes sense to compare the movement of the energy company’s stock with the dynamics of oil futures, etc. This function can be used in pair trading or arbitrage trading. The left vertical panel contains a complete set of graphical tools.
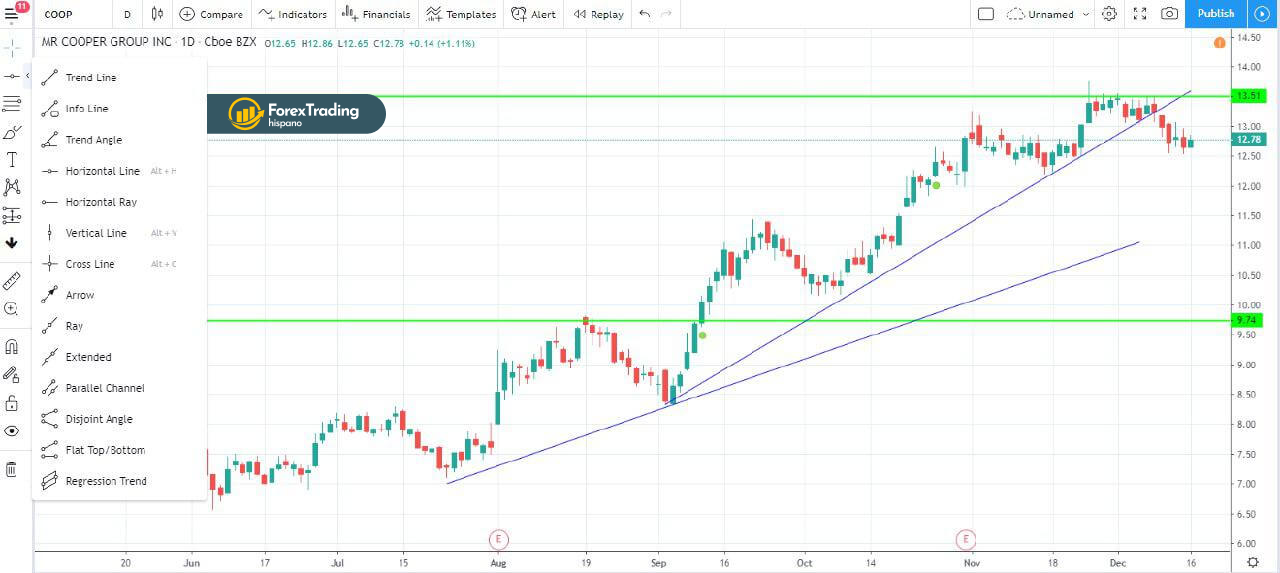
The main windows of the left panel:
- Cursor;
- Lines – trend, horizontal, vertical, rays, segments, etc .;
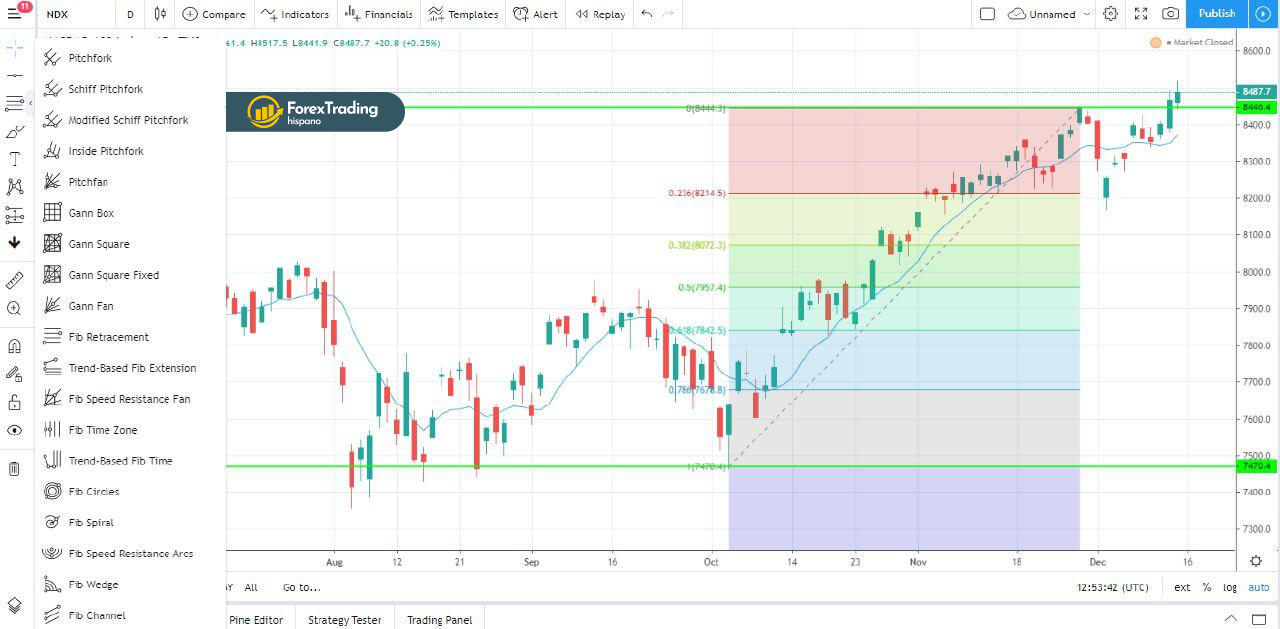
- Graphic tools – Gann pitchforks and squares, Fibonacci tools;
- Means of drawing any geometric shapes – triangles, rectangles, ellipses, etc .;
- Window of text elements – labels, footnotes, price tags;
- Window contains tools for drawing on pattern charts – “head and shoulders”, “triangles”, “double (triple) peaks (troughs)”, “Elliot waves”, cyclic lines;
- Window for risk control, visualization of extreme points, levels, ranges;
- Set of icons.
Also, from the left panel, you can control the scale, hide or delete drawing objects.
A convenient and useful service is provided for traders, which allows you to control the ratio of risk and profit without complex calculations.
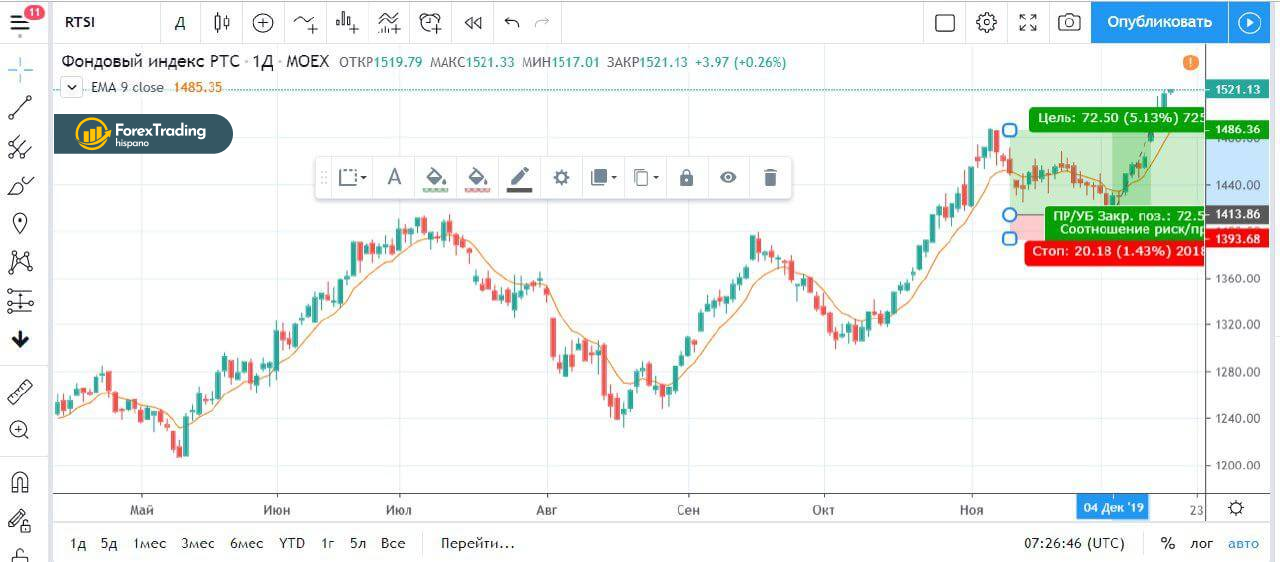
Depending on the direction of the transaction, the Long or Short menu is selected, information on the size of profit and loss in points and percent appears on the chart, while the profit field is colored in green, loss in red, which allows you to visualize the ratio. By moving the Stop-loss and Take Profit lines, you can change the proportions, choosing the most suitable option, based on the technical picture. The right side of the screen contains fundamental information and public chat.
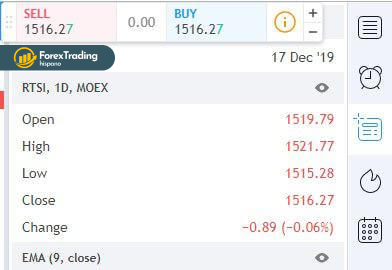
Information about the current price, its change during the trading session, daily range, 52-week range, trading volume, all news about this instrument, information about the company’s financial indicators is displayed for the selected instrument. From the right panel, you can open up-to-date macroeconomic statistics, company reports for the current date, and the next three days.
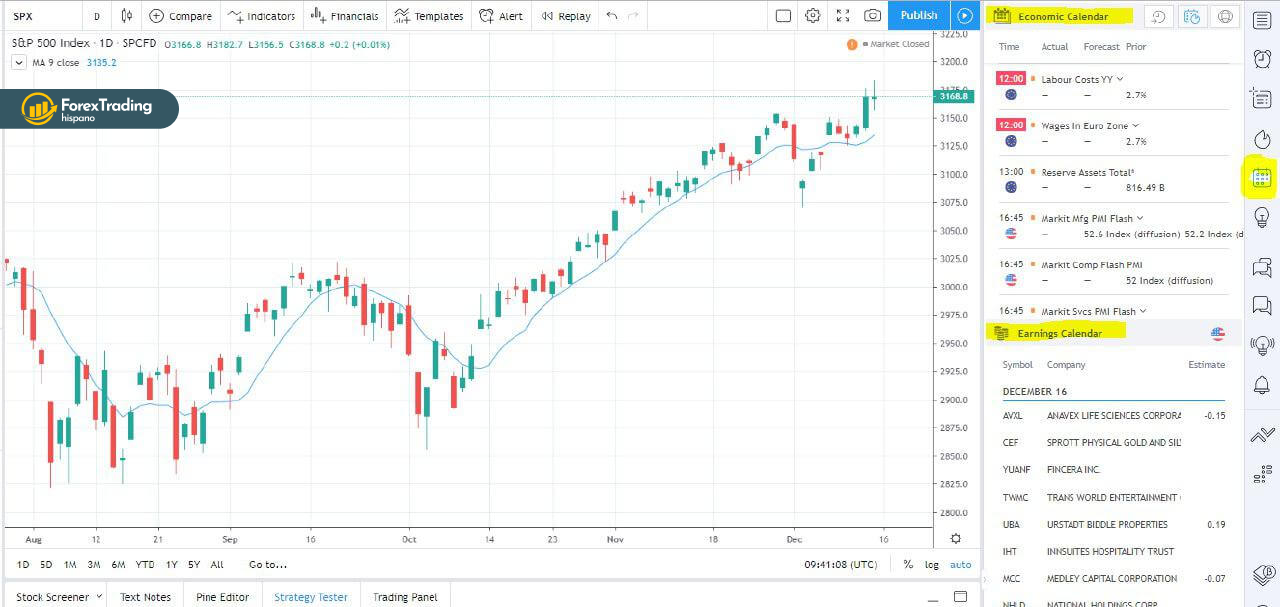
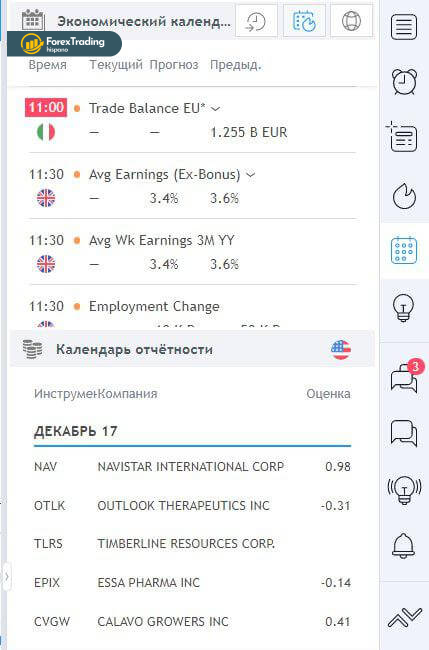
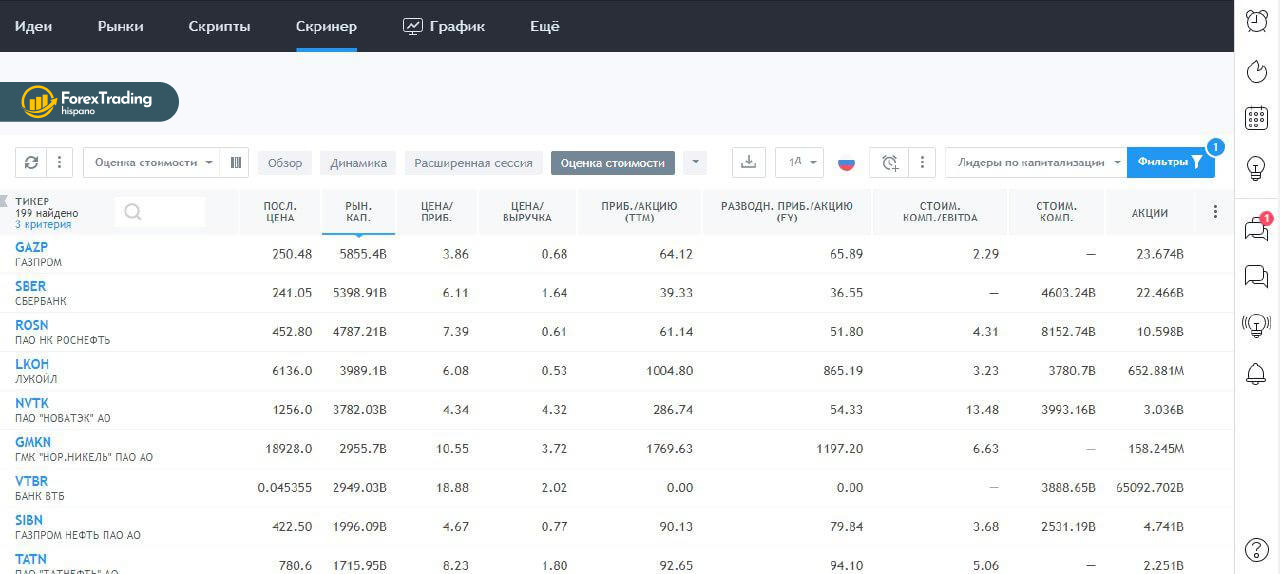
Economic calendar and calendar reports for the current date. The bottom panel contains a convenient stock screener. The selection can be carried out according to various parameters – valuation, technical characteristics, dividends, dynamics, expert rating, profitability, etc.
The platform makes it possible to carry out trading operations with any instruments by connecting a broker account.
At the moment, the service works with companies:

- OANDA;
- FOREXCOM;
- Commodity Brokers CQG;
- ModalMais;
- Poloniex;
- iBroker;
- Alor.
A deal can be opened directly from the trading panel.
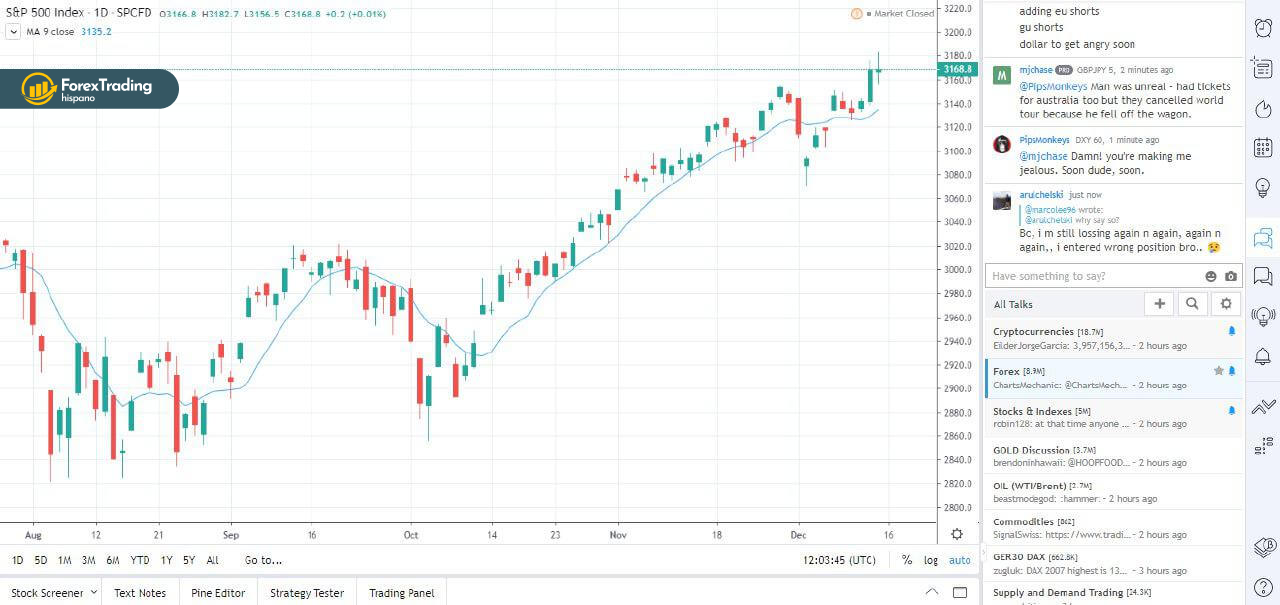
The advantage of the possibility of “live” communication with other traders

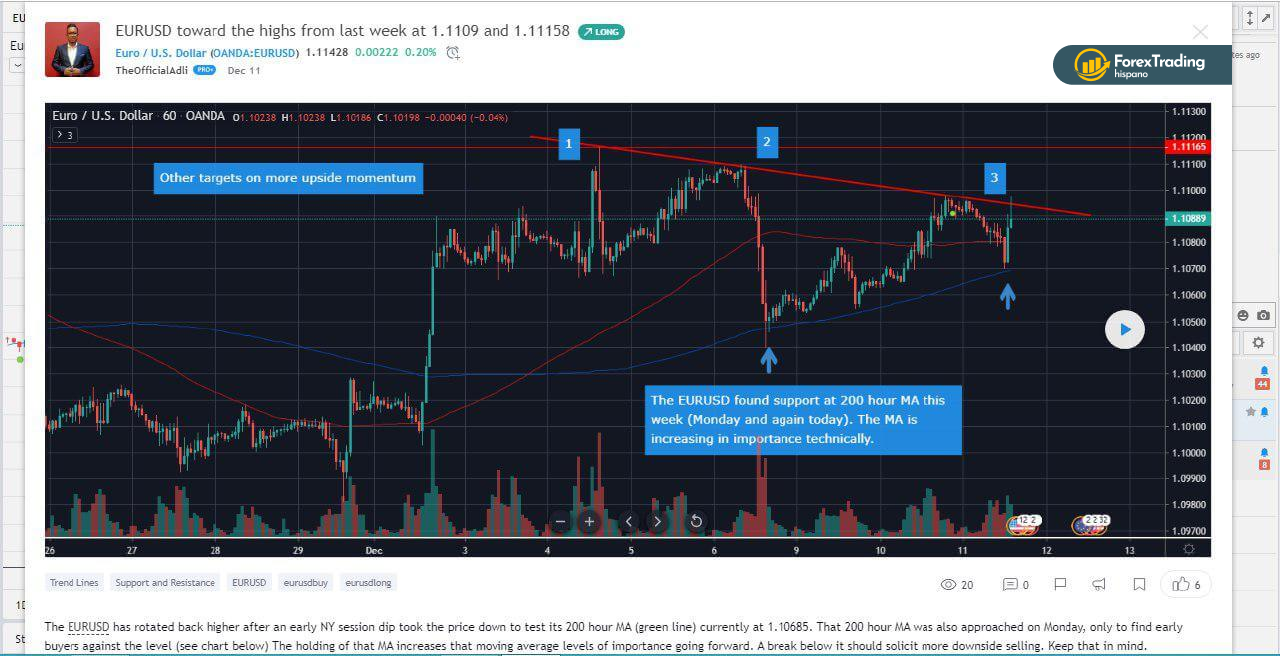
One of the most important advantages of the service is the possibility of “live” communication with other traders, in fact, for what this project was conceived. On the site, you can get acquainted with the trading ideas of your colleagues, see their forecasts, and then track their performance. You can post your ideas and forecasts.
A large amount of educational material is placed on the platform, which allows you to gain new knowledge, a new experience that is necessary for practitioners and, especially, novice traders.
The ideas of other traders can be linked to their chart, they will be displayed in green, yellow, or red dots.
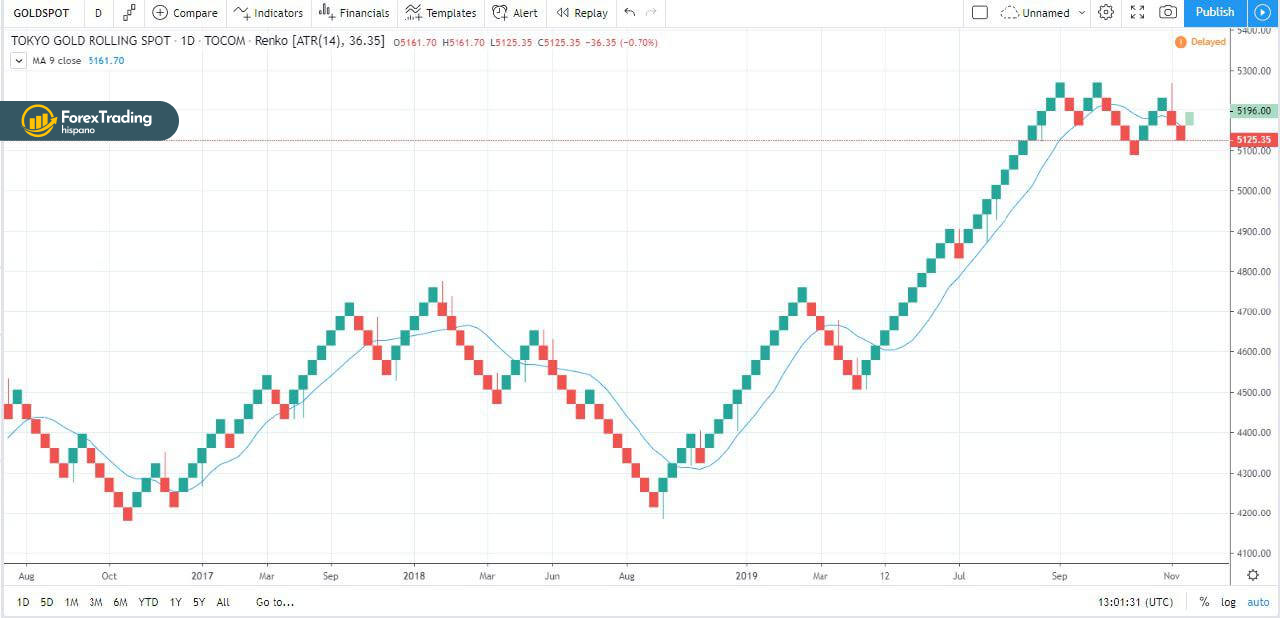
Hovering over the cursor, you can see the author of the idea. The message can be expanded by clicking, having received a full-screen image with the analysis and forecast of the author. There is an arrow on the right, with its help, at the end of the transaction, you can see the result. It should be noted that there are free and paid versions of the platform. Free is practically unlimited in functionality. A paid subscription gives the purchaser Pro status, which allows you to use several charts in one window (multi-window); eliminates sponsorship advertising; makes it possible to save an unlimited number of schedules (there are restrictions in the free one); an unlimited number of indicators on the chart (there are limitations in the free version); real-time data for many exchanges; as well as exotic tools like Renko, Kagi, “tic-tac-toe” charts on timeframes for less than a day.
Conclusion
Trading View platform is a leader in its functionality. The opportunities for conducting technical analysis are unique, so traders around the world have appreciated the strengths of the service. The user audience is constantly growing and according to the latest data exceeds 8 million per month. The importance of analytical work for a trader should not be repeated. Trading View service has huge potential in this regard.